18th Feb 2025 Intraday Trades & Concept
Market Opens
Today Banknifty gapped down by –47.05 points, opening at 49,211.85, while Nifty edged up with a +4.15 points gap-up to 22,963.65.
After yesterday’s impressive late-session bullish candle, I was curious to see if the momentum would carry into the new trading day. As it turned out, both indices faced continuous early selling, undermining the previous session’s bullish close. Below is a recap of how the trades evolved—including a brief mishap with a wrong strike—and what I took away from the moves in both Nifty and Banknifty.
Early Observations: Fake Momentum?
Yesterday’s late upsurge in both indices signaled potential strength. However, as the market opened, neither index traded above the previous day’s high. Instead, an immediate wave of selling set in. This implied that if the bulls had really gained control, we’d typically see price holding or extending above that high. The retreat suggests yesterday’s push might have been short covering or a “fake” bullish move that lost steam overnight.
I haven’t analyzed OI deeply before, but it seems more traders added positions on both calls and puts this morning, while volumes receded.
First Trades and a Surprise Strike
Nifty’s Wrong Strike Entry

I rely on a 15-minute setup and 5-minute price action for Nifty. While setting up on my desktop, I had the 23,200 CE chart ready for a potential short. On my phone, however, I accidentally sold the 22,500 CE at ₹423.45. When the price dropped only a few points, I noticed an unrealized profit of over ₹1,000, which felt disproportionate for such a small move. That’s when I realized my mistake—I was trading the wrong strike price. I exited quickly, pocketing a small profit but also reminding myself of the importance of double-checking strikes before confirming any order.
Banknifty’s Missed Opportunity

Not long after, I took a Banknifty trade by selling the 50,500 CE at ₹150.15 with a Stop Loss at ₹165. A brief bullish flicker prompted me to exit at ₹155.30.
Mid-Morning Breakdowns and SL Hits
Nifty’s Late Entry and a Trendline Breakdown

Despite the early confusion, I redrew a trendline in Nifty’s 15-minute chart and waited for a fresh breakdown confirmation. As the price slipped again, I jumped in selling 23,000 CE at ₹89.55. Ideally, I would have entered around ₹92.40, but I was late to the trigger. My target was ₹72 with a Stop Loss at ₹101. Once a new 15-minute candle formed, I tightened my SL to ₹83, noting that multiple red 5-minute candles were stacking. A green candle was due any moment, especially since the price was nearing a marked support zone.
Sure enough, a green candle emerged, knocking out my tightened SL. It’s a classic example of how trailing stops in a fast market can sometimes lock in smaller-than-planned profits—or transform a potential gain into a breakeven/loss exit.
Banknifty’s Parallel Move

A similar scenario played out in Banknifty. After I took my short trade, the price briefly reversed upward, only to drop again and close below the day’s low. Ultimately, it touched 48,815–48,893, a critical support region, confirming that the overall downtrend was intact—just more volatile than I’d hoped.
Post-10:30 AM: A Glimpse at Midday Reversal

True to form, I closed my system around 10:30 AM, returning at 12:00 PM. By then, both Nifty and Banknifty had bounced from their respective supports (Nifty near 22,800 and Banknifty from somewhere above the 48,800 zone). It appears another intraday reversal was underway.
Now, 23,000 in Nifty stands as a crucial round number to watch for a potential breakout. Banknifty, meanwhile, hovers between well-watched levels, offering no clear intraday trade for me at the moment.
Spot vs. Options Chart Nuances
Intraday, the options chart sometimes signaled trades faster than the spot chart, or indicated levels that didn’t align perfectly with actual spot moves. This discrepancy can trigger confusion, and it’s why I typically anchor my decisions in the spot chart. While the 5 EMA setup offered additional short opportunities, I chose to remain sidelined, preferring to check the market again at noon.

Near midday, I tried one last small-stop-loss trade in Nifty, noticing a 5-minute trendline breakdown that also matched a 15-minute candle setup. With a 3-point SL, I aimed for a 1:5 reward, but the price reversed, hitting my SL almost immediately.
Final Thoughts and Lessons
- Verify Strikes Before Execution
My mix-up in Nifty—selling 22,500 CE instead of 23,200 CE—was a lucky near-miss that could have been worse if the market moved sharply. Double-checking the strike, especially when toggling between devices, is essential. - Late Entries Can Cut Potential Profits
In both Nifty and Banknifty, slight delays let me enter at less-favorable prices. Timeliness matters when your strategy is reliant on quick breakouts or breakdowns. - Round Numbers and Old Levels
Nifty’s bounce from 22,800 proves that past support remains relevant. Banknifty’s behavior near round levels (49,000 or 48,800) continues to shape my caution.
In the end, the day added yet another chapter to the ongoing tug-of-war between bulls and bears. Momentum seemed to evaporate soon after each breakdown, underscoring that intraday reversals can strike quickly. As I monitor 23,000 in Nifty and reevaluate possible trades in Banknifty, I’ll remain focused on confirming setups and managing risk—hopefully without mixing up my strikes again.
Closing Figures
By the closing bell:
- The Sensex dropped 29.47 points to 75967.39
- The Nifty slipped 14.20 points to 22945.30
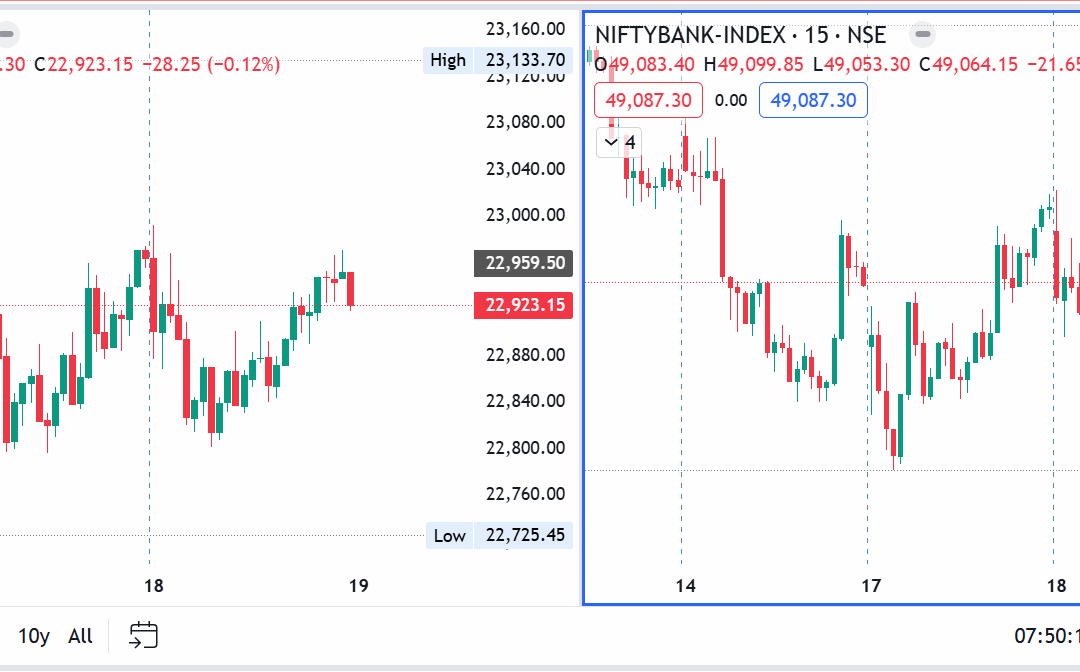
- Banknifty fell 171.60 points to 49087.30
