11th Feb 2025 Intraday Trades & Concept
Market Opens
The trading day kicked off with Nifty opening at 23,883.55, a near-flat start of +1.95 points, while Banknifty presented a more noticeable gap-down at 49,812, lower by 168.85 points.
Right from the open, Banknifty showed a clear inclination toward a bearish move. Below is how the session unfolded, the trades I took, and what I learned from the day’s split behavior in the two indices.
Early Banknifty Sell: Aiming for Quick Points
Entry on 5-Minute and 15-Minute Confirmation

Noticing the early downside momentum, I used my 5-minute price action and 15-minute setup for confirmation. This gave me enough conviction to sell 50,000 CE at ₹680.75, targeting a quick 50-point capture. Banknifty followed through initially, showing a good bearish leg that validated my short-call position.
Nifty’s Slow Follow-Through

While Banknifty proceeded lower, Nifty delayed its move. Once Nifty broke its day’s low, I opened a second trade, selling 23,500 CE at ₹66.20, placing my Stop Loss at ₹75. Unfortunately, Nifty didn’t provide the same solid downside continuation as Banknifty. My SL got triggered, and I had to close that position at a loss. Meanwhile, the Banknifty short position remained intact as the index didn’t threaten my Stop Loss.
Diverging Indices and Missed Synchrony
Banknifty’s Downtrend vs. Nifty’s Reluctance

Even as Banknifty continued its descent in line with the 15-minute bearish setup, Nifty moved hesitantly. I contemplated re-entering Nifty shorts since the options chart suggested potential downside, but the spot chart didn’t confirm the same aggression. That conflict kept me sidelined.
Managing My Banknifty Target
For Banknifty, my options-chart target was ₹630, which the price nearly reached at ₹612. I set a trailing Stop Loss at ₹630 and aimed for a 49,500 spot target, aligning with the chart’s support region. However, consolidation kicked in around 10:30 AM, leading me to exit prematurely to avoid a possible bounce. As often happens, right after I closed my position, the market continued downward, eventually touching 49,500.
Market Action Midday: “What If” Moments
Nifty’s Potential Re-Entry
Looking back, Nifty’s options chart remained somewhat aligned with a bearish tilt, but the spot chart failed to provide the confirmation I needed. My earlier loss also made me more cautious. Had I decided to re-enter a Nifty short, I might have gained 15–20 points, but I chose not to force a setup that didn’t align with both price and momentum.
Banknifty Hits 49,500, Then Presses Lower

As expected, Banknifty eventually fell to 49,500 and started ranging. Around 12:45 PM, it broke below that level and headed toward the 49,180–49,280 zone, where it formed a “dragonfly” candle on the 15-minute chart, signaling a potential short-term bottom or a pause in selling.
Afternoon Observations and What I Missed

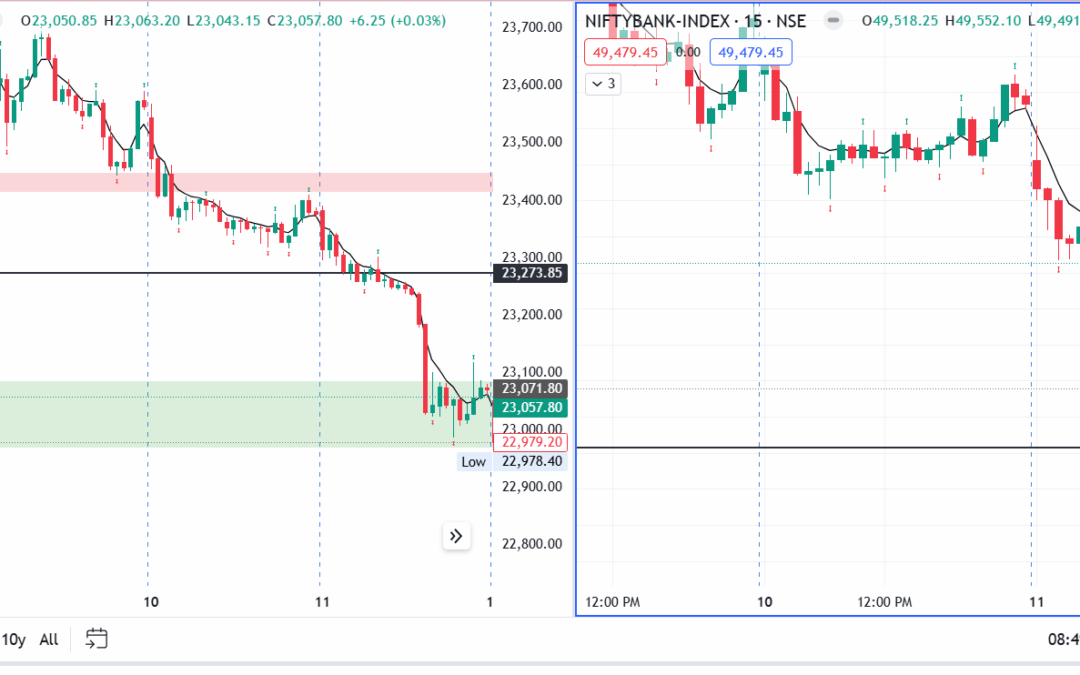
At 12:45 PM, Nifty also showed a strong bearish candle, dropping below a previously marked green support zone. The next logical target was the 23,000 round figure. By that point, I had checked out of the market for a while—feeling drowsy—and missed out on potential trades that materialized during the lunchtime slump. It’s a reminder that the market doesn’t always pause mid-session and can create significant moves at times many consider “quiet.”
Closing Figures
By the closing bell:
- Sensex dips 1,018.20 points
- Nifty slumps 309.80 points to 23,071.80
- Banknifty fell 577.6 points

Lessons from a Day of Divergence
- Trade Synchronization: Even if Banknifty and Nifty both look bearish, their time frames and momentum can differ substantially. Waiting for genuine alignment often increases trade confidence.
- Exiting Prematurely: My early exit in Banknifty left profit on the table. A trailing Stop Loss was in place, but fear of a bounce nudged me out. Proper discipline might have allowed the trade to play out fully.
- Spot vs. Options Chart: The divergence between the options chart (suggesting further downside) and the spot chart (showing mixed signals) is a crucial reminder that relying on both is key to better entries and exits.
- Midday Moves Can Matter: Leaving the screen around midday is common, but markets can move substantially during this time. Staying alert or setting alerts might have uncovered more trading opportunities.
- Follow Your Own Plan: Despite seeing potential re-entries, the absence of perfect alignment—and a recent Stop Loss—held me back. This discipline likely saved me from forcing trades in uncertain conditions.